Overall Statistics by Category
Rollover Safety
Source: http://www.nhtsa.dot.gov/hot/rollover/figures.html#figure4
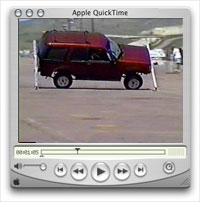
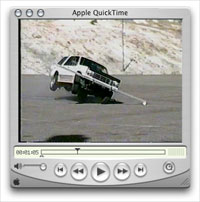
Two videos of Ford Explorers maneuvering
They're both between 36 and 40MB each and require Quick Time.
Source: SUVs, Suddenly Upside-down Vehicles
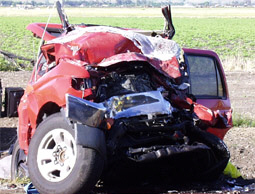
Furthermore, when vehicles do roll over, SUVs kill their occupants more often than cars.
SUVs rollover in 37 percent of fatal crashes, compared to a 15 percent rollover rate for passenger cars. Rollover crashes accounted for 53 percent of all SUV occupant deaths in single vehicle crashes in 1996. Only 19 percent of occupant fatalities in passenger cars occurred in similar crashes.
Source: http://www.hwysafety.org/facts/factsimg/pass4.gif
Within the SUV category, smaller SUVs are the worst. Smaller SUVs - with a wheelbase of less than 100 inches - had a disproportionately high incidence of fatal rollover crashes. (Honda CR-V = 103" wheelbase. Toyota Rav 4 = 98".) Small SUVs were involved in rollover crashes more than four times as often as the average passenger car.
Source: http://www.hwysafety.org/facts/factsimg/pass4.gif
Here are Rollover Resistance Ratings:
http://www.safecarguide.com/exp/rollover/idx.htm
Trucks & SUVs Kill others
 |
|
| The following chart is from an
IIHS News Release dated 2-10-98. The left-most column gives
the weight class of the vehicles in the first column of each pair (that
is, " cars,", "pick-ups," & "SUVs"). Columns 1, 3, and 5 show
the death rates (per million vehicles per year) for cars, pick-ups, and
SUVs of different weights; columns 2, 4 and 6 show the death rates for
the occupants of the other vehicle in the two-car collision.
|
|
Occupant death rates in two-vehicle crashes, 1990-95
model passenger vehicles versus other vehicles ( deaths per million vehicles per year)
|
|
Weight Class (lbs) |
Vehicle crash pairs 1990-1995 |
|
Cars |
Pick-ups |
SUVs |
|
Cars |
Other |
Pick-ups |
Other |
SUVs |
Other |
|
less than 2500
|
109 |
35 |
|
105 |
58 |
|
|
|
2500-2999
|
83 |
43 |
89 |
88 |
54 |
75 |
|
3000-3499
|
60 |
48 |
56 |
116 |
53 |
75 |
|
3500-3999
|
53 |
57 |
52 |
115 |
37 |
92 |
|
4000-4499
|
49 |
58 |
44 |
144 |
29 |
91 |
|
4500-4999
|
|
45 |
169 |
29 |
110 |
 |
5000 +
|
|
38 |
181 |
25 |
112 |
(Of note, occupants of the lightest cars have dramatically
higher death rates.
Also, most significantly from a safety point of view, heavy pickups and SUVs are associated with
far higher death rates
in the OTHER vehicle than in themselves, or than death rates caused by comparably heavy cars. )
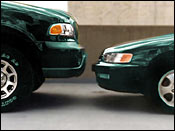
SUV-to-car collisions are six times more likely to kill the
occupants of the smaller vehicle when compared to a normal car-to-car collision. You may be safer inside an
SUV, but you're at greater risk of killing others in the event of an accident.
Source: http://www.safecarguide.com/exp/safety/idx.htm
Passenger cars experience the greatest risk in frontal and side impact. For every driver fatality in a full-size van striking a car from the front, there are six driver fatalities in the passenger car. For every driver fatality in a full-size pickup, there are 6.2 driver fatalities in the car.
The problem is much worse for side crashes. The higher frame rails of a pickup truck or SUV may override the rails of a passenger car, resulting in greater intrusion. Likewise, the higher engine compartment poses a risk for passenger car occupants. When a pickup truck strikes the side of a passenger car, there are 26 fatalities among passenger car drivers for every driver fatality in the pickup. When a SUV strikes a passenger car, there are 16 driver fatalities in the passenger car for every driver fatality in the SUV.
Source: http://www.nhtsa.dot.gov/hot/FinalSUVStatement.html
Backover Accidents
According to Kids 'N Cars, which is compiling statistics on these types of incidents, 'in 2002, at least 58 children died as a result of being backed over by a motor vehicle. (more than one per week) Sadly, in over 60% of these incidents, there was a parent or close relative behind the wheel.'
and
According to a Kids 'N Cars and Consumer Reports article, the size of a blind spot can range from just 12 feet for a Honda Accord to 30 feet for a Chevrolet Avalanche. Short drivers have an even longer blindspot, up to 50 feet for the Avalanche.
Source: http://www.keepkidshealthy.com/welcome/safety/suv_dangers.html
SUVs can't avoid accidents as well.
Braking distance
In addition to larger turning radius at a given speed (ie more likely to roll over), braking distances tend to be longer. Compare the braking distances from 60 mph to 0 in the following illustration. In a common accident scenario, imagine you've encountered a stopped semi truck while going around a blind curve. The semi is 142 feet in front of you. Which is the safest vehicle to be in?
Porsche Boxster: 120 feet
Oldsmobile Intrigue: 131 feet
Dodge Caravan SE: 135 feet
Pontiac Transport: 141 feet
Chevrolet Suburban: 155 feet
Statistical Source (for both the image and text): Edmunds Car and Truck Guide
Additional Reading:
http://money.cnn.com/2003/01/15/pf/autos/SUV_safety/index.htm?cnn=yes
Backovers:
http://cbsnewyork.com/investigates/local_story_325213618.html
https://www.celticsplayershop.com,
https://www.bullsplayershop.com,
https://www.heatplayershop.com,
https://www.bucksplayershop.com,
https://www.knicksplayershop.com,
https://www.76ersplayershop.com,
https://www.nuggetsplayershop.com,
https://www.clippersplayershop.com,
https://www.lakersplayershop.com,
https://www.grizzliesplayershop.com,
https://www.sunsplayershop.com,
https://www.kingsplayershop.com,
https://www.jazzplayershop.com,
https://www.bravesplayershop.com,
https://www.redsoxplayershop.com,
https://www.cubsplayershop.com,
https://www.whitesoxplayershop.com,
https://www.astrosplayershop.com,
https://www.dodgersplayershop.com,
https://www.metsplayershop.com,
https://www.yankeesplayershop.com,
https://www.giantsplayershop.com,
https://www.bluejaysplayershop.com,
https://www.nflplayerpro.com,
https://www.nbaplayerjersey.com,
https://www.nhljerseysfans.net,
https://www.mlbprouniform.com